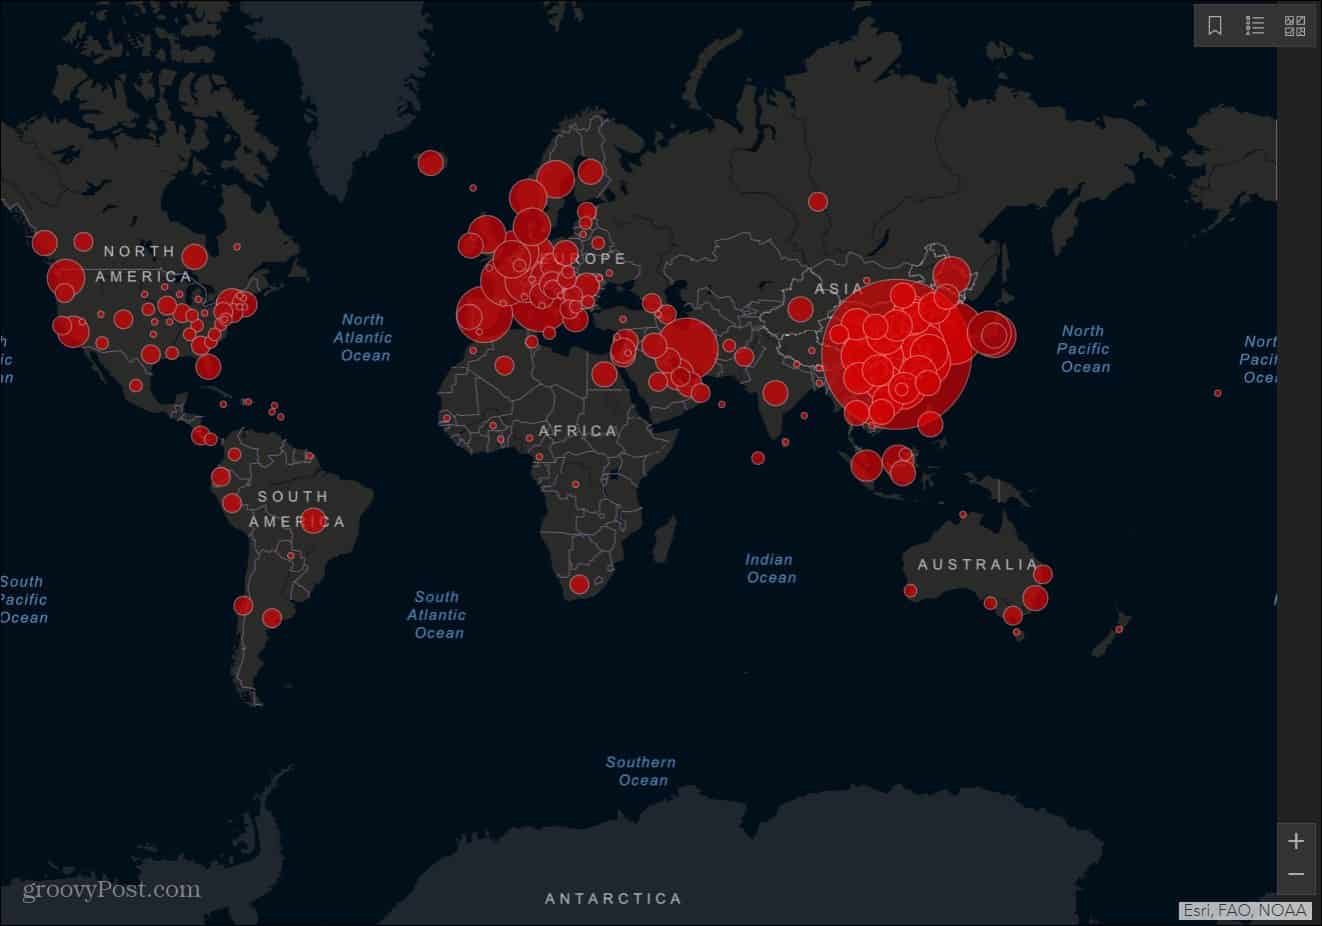
The map, updated several times each hour, shows how the virus is spreading in near real-time. For a more thorough analysis, the tool offers a zoom feature so you can see how the number of cases on a micro-level. The map organizes cases by total confirmed, total deaths, and the total recovered. In the United States, you can view the number of cases on a state-by-state basis. The map includes data from the U.S. Centers for Disease Control and Prevention, city and state-level authorities, the World Health Organization, and other governmental health agencies around the world.
County by County
For those looking for county-by-county infection numbers in the United States, there’s an online tool developed by the University of Washington. The Novel Coronavirus (COVID-19) Infection Map, like the one from John Hopkins, shows the number of cases by confirmed, recovered, and death. The University of Washington doesn’t update this site nearly as often, but the information is important nonetheless. COVID-19 was officially named by the World Health Organization on February 11, 2020. The disease was first identified in Wuhan China and currently has no cure. It generally causes upper-respiratory tract illnesses.
Current Information
As of early Wednesday, March 11, the number of confirmed cases of COVID-19 worldwide stands at just over 121,000, with 1,039 of those in the United States. Of those affected, over 66,000 are now recovered from the virus. In total, over 4,300 have lost their lives so far because of the disease. Nearly 93 percent of worldwide deaths have occurred in three countries, China, Italy, and Iran. In the U.S., there have been 29 deaths so far. All but six of these have occurred in Washington state.
![]()


