Just like when I showed you how to check if memory is going bad, this time, we’ll take a look at how it is being used. The tools we’ll look at are called the Resource Monitor and the Performance Monitor.
Check Computer Memory Usage Easily
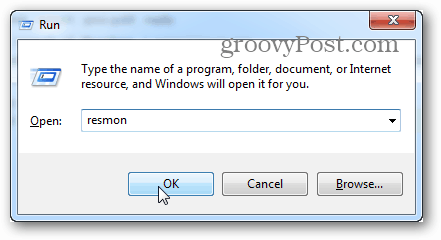
To open up Resource Monitor, press Windows Key + R and type resmon into the search box.
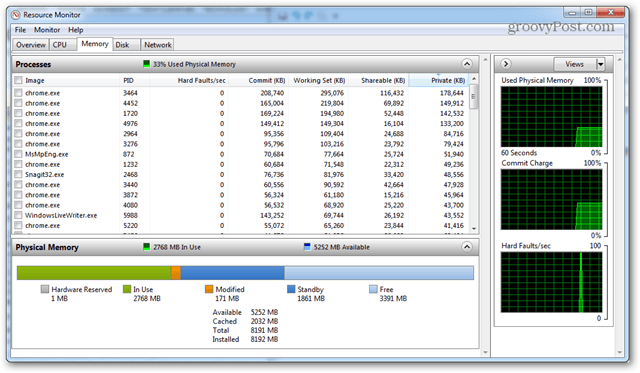
Resource Monitor will tell you exactly how much RAM is being used, what is using it, and allow you to sort the list of apps using it by several different categories. However, it doesn’t offer much else. For more details, you’ll need to open up Performance Monitor.
Check Detailed Memory Usage with Performance Monitor
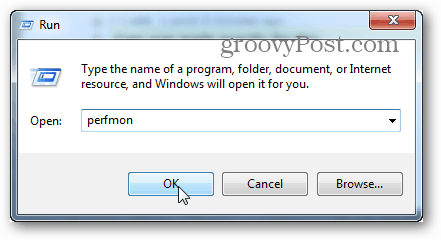
To open up Performance Monitor type: perfmon into the Run window (Windows Key + R).
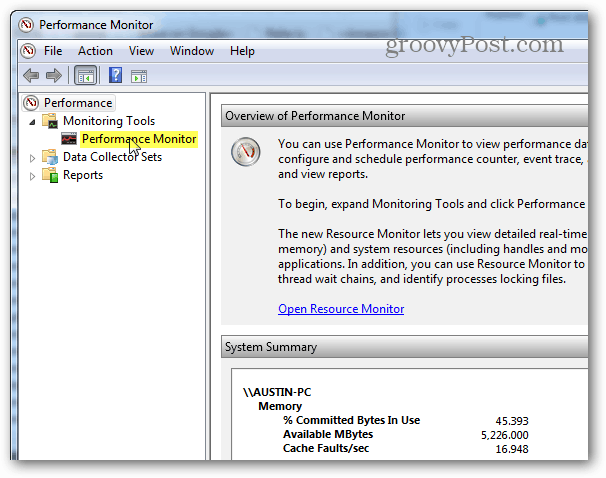
In the window that comes up, click the Performance Monitor under Monitoring Tools in the left pane.
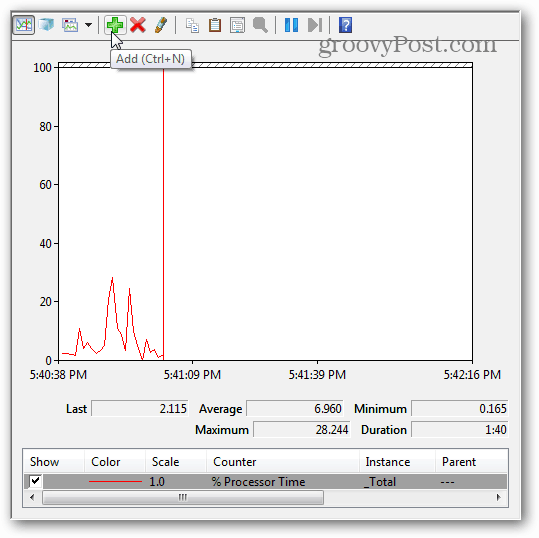
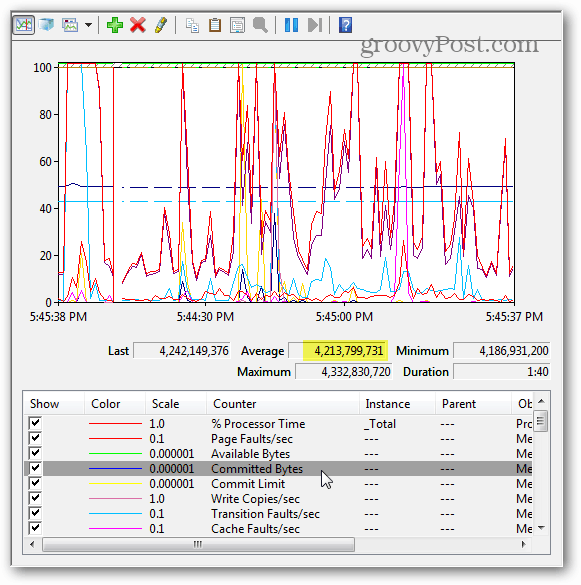
The right pane turns into a live graph/chart that looks like the screenshot below. Since you’re looking at memory usage, you need to add it to what’s tracked by the live graph. Click the green plus symbol or hit Ctrl + N on your keyboard.
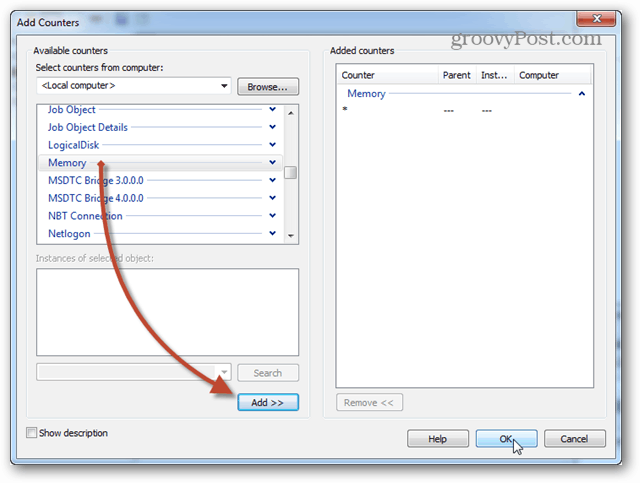
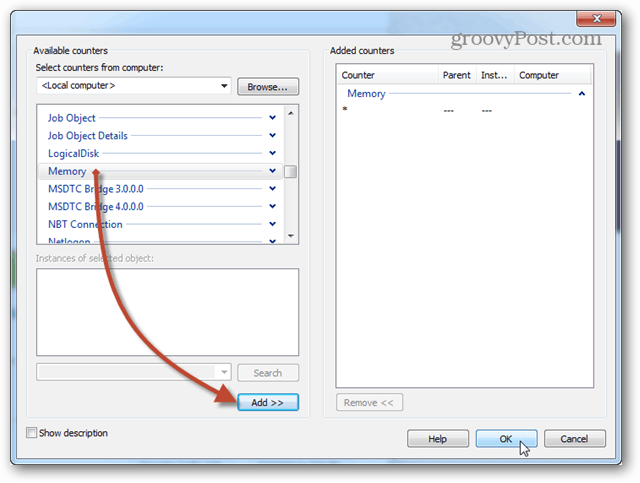
Now scroll down the list of counters in the left pane and select Memory, then click Add. Memory is added as an active counter in the right pane, and once it is, you can click OK to save changes and exit.
Now back on the graph, the memory will start to be tracked. If you’re looking for average memory use over time, click the Committed Bytes line, and it will display that information in the box above. There are a few things to note about this chart:
The graph and stats are generated live.This chart only shows data as far back as the moment you added the counter type.
Schedule & Log Performance Monitoring
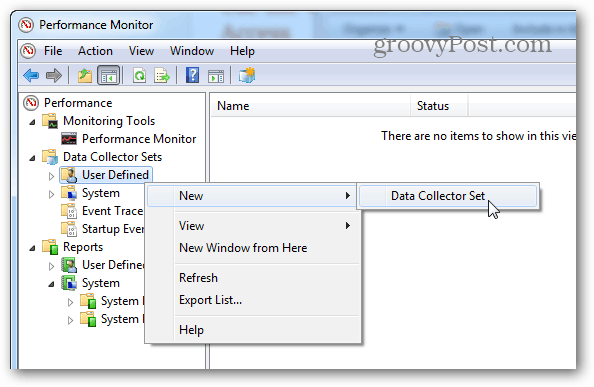
If live reporting isn’t what you’re looking for, scheduled/logged monitoring might work better. Right-click on the Data Collector Sets and select User Defined > New > Data Collector Set to set this up.
Give the data collector set a name (it can be whatever you like), and then set it to Create Manually (Advanced) before clicking Next.
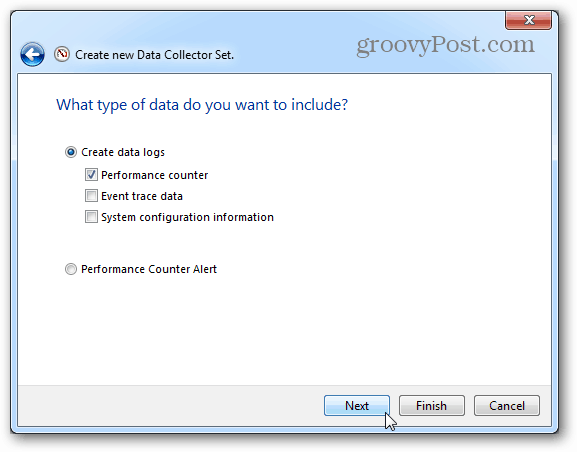
Next set it to a Create Data Logs, check the Performance counter box, and click Next.
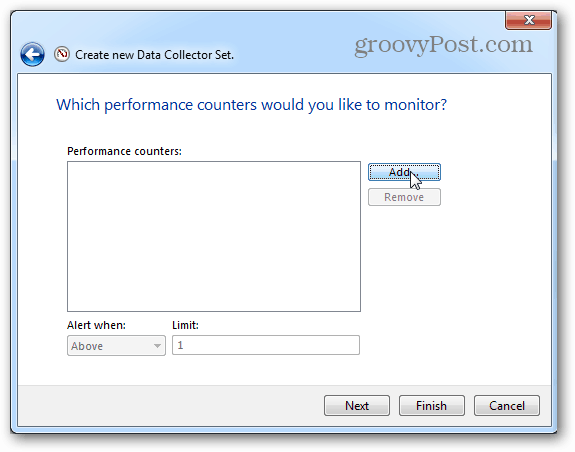
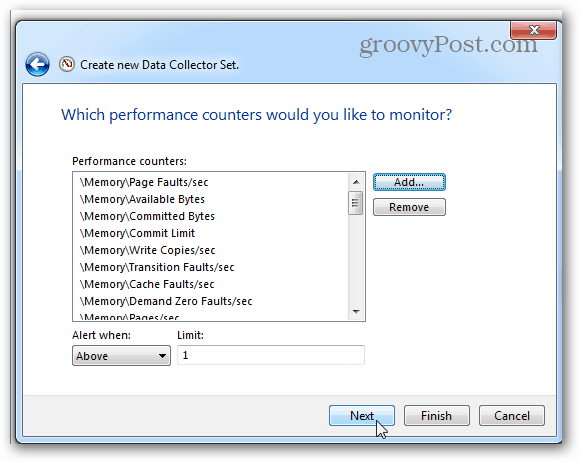
On the next page, click the Add button.
Just as before with the live graph, add Memory to the list of active counters.
The same page where we clicked the Add button will show a list of the counters you just added. Now click the Next button to continue.
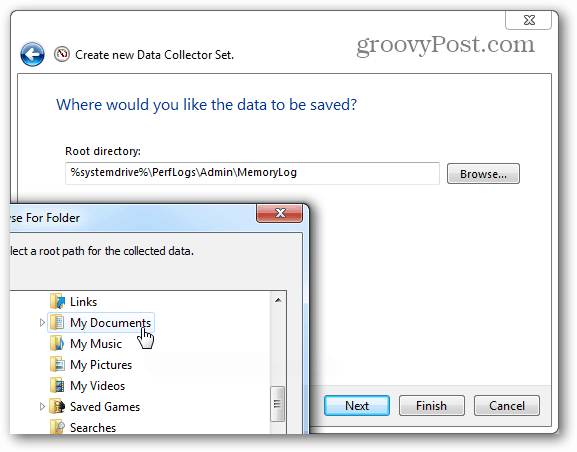
Then it’s time to choose where the logs will be saved. I suggest your Documents folder or somewhere easy to find.
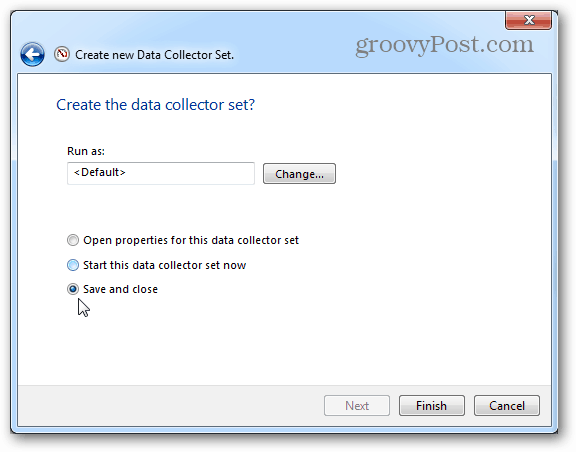
Now you can choose to Save and close, and then press Finish to exit.
The performance log is ready to run; all you need to do is start it. There are two different ways to go about starting this thing too. The first is to right-click on it and manually start it. Yeah, annoying. The second way is to right-click and open up the Properties window.
Within the properties window of the data collector, you can set up when you want this thing to log system performance. You can create multiple schedules for multiple different times. It’s quite useful!
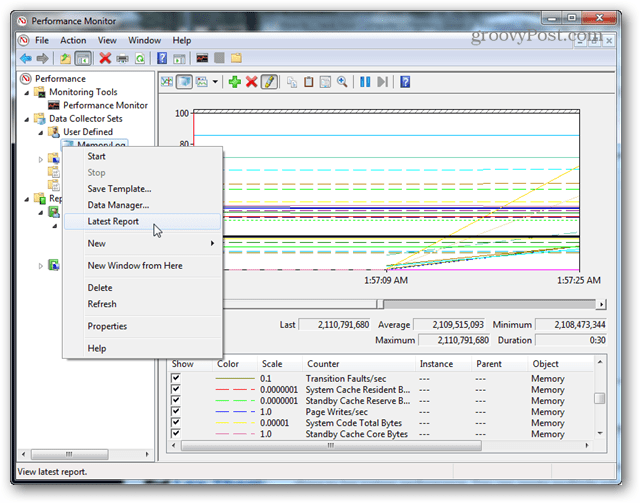
Once you’ve run a log, all that’s left to do is open it up and view the results in Performance Monitor.
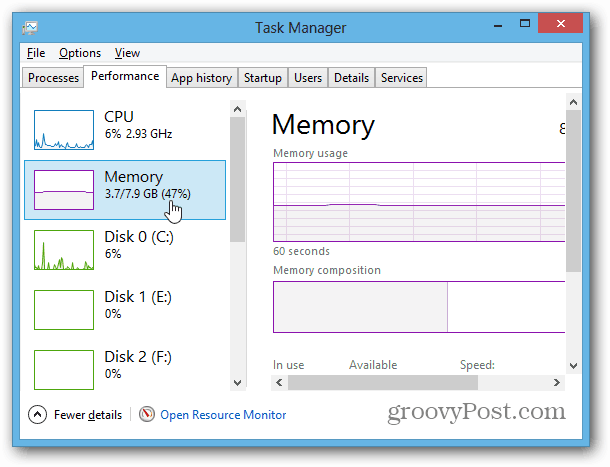
These tools are still present in Windows 8 too. But it’s worth mentioning that Task Manager in Windows 8 and RT provides a lot of additional info concerning memory usage on its own.
Really appreciate! Comment Name * Email *
Δ Save my name and email and send me emails as new comments are made to this post.
![]()
